Forex is short for the foreign exchange market, where individuals, companies, and governments trade different currencies with each other. In short, the forex market is a marketplace for buying and selling currencies.
Unlike the stock or bond markets, forex trading moves across different financial centers around the world during different time periods. It starts in Sydney, then moves to Tokyo, London, Frankfurt, and finally New York before returning to Sydney and starting a new round of forex trading!
Unlike the stock or bond markets, forex trading moves across different financial centers around the world during different time periods. It starts in Sydney, then moves to Tokyo, London, Frankfurt, and finally New York before returning to Sydney and starting a new round of forex trading!
They may sound like big numbers, but the forex market has a trading volume of up to $5.3 trillion!
The most attractive thing about forex trading is that ordinary people like us also have the choice to trade! These people are called “retail traders”, and all we need is a computer at home connected to the internet and then log into our personal trading account on RockGlobal to trade in the forex market.
Do you want to trade forex with companies, governments, and central banks?
Just open a real (or demo) account on RockGlobal.
Forex traders have a time advantage that other time zones cannot match, and they can use two-way and margin trading with leverage, and choose from the widest range of mainstream financial derivatives.
If you ask someone on the street about their opinion on forex trading, you are likely to receive the following answers:
“Why trade in the forex market?”
“The brokers will steal your money.”
“In the long run, investing in blue-chip stocks is much safer.”
Unfortunately, for some reason, many people view forex as a high-risk, get-rich-quick scam. But is this a fair evaluation? The answer is actually no.
Just like most things in life, people are afraid of what they don’t understand. If you don’t take the time to learn and understand forex trading yourself, and instead trade with unregulated brokers, hoping for huge profits, do you think your funds are safe?
On the other hand, if you take the time to educate yourself on forex trader-related knowledge, learn about the leverage you can use, the financial regulations of brokers, and most importantly, how to manage risks, then forex trading is likely to be your ideal market trading!
So, what are the advantages of forex trading compared to trading in stocks and other markets?
Unlike other forms of investment, forex trading is easy to get started with. When you compare the amount of capital required for forex trading to the startup capital required for stocks, options, or futures trading, forex trading is much more accessible.
Forex trading only requires a computer, an internet connection, and a willingness to learn! You can open a trading account with brokers like Rockglobal for as little as $200 and take advantage of the extensive free forex education services available on our website!
As you just read, forex trading is inexpensive and does not require you to deposit tens of thousands of dollars to start. You can open an account and start trading forex with just $200.
Another huge advantage of forex trading over stocks, options, and futures is the cost of entering and exiting trades. On the other hand, forex allows you to pay just 0.01 lots of the standard deviation.
Ability to trade forex anytime, anywhere
Unlike your nine-to-five job, forex trading does not limit you to your desk or workplace. You can trade forex anytime, anywhere, with trading times and locations entirely up to you.
All you need is an internet connection to access your MetaTrader 4 account on a computer, laptop, web browser, tablet, or mobile phone. Stay connected to the market at all times and seize trading opportunities that you can profit from!
The difference between forex traders and stock traders lies in the transparency of the forex market.
The forex market is the largest and most liquid market in the world. Register for a free demo forex trading account and start your trading journey with Rockglobal.
The forex market is a 24-hour market, with the most obvious difference from other trading markets being its time continuity and spatial unconstraint.
As outlined in the “What is Forex” section, forex trading moves to different financial centers around the world during different time periods. It starts in Sydney, then moves to Tokyo, London, Frankfurt, and finally New York before returning to Sydney to start a new round of forex trading!
The major Forex trading sessions are outlined in the following table:
Forex trading sessions:
As a basic rule, it is best to trade the corresponding currency pair during its respective trading session. For example, due to market-moving news releases, the AUD/USD pair is more likely to experience volatility during the relatively quiet Sydney session. On the other hand, the EUR/GBP may not experience the same type of volatility during the Asian session when both Europe and the UK are asleep.
Now, you may see some forex trading sessions actually overlap with each other. During these trading sessions, high-quality volatility typically occurs due to the highly liquid conditions of your time zone, making it one of the best times to trade forex. But why are they considered high-quality volatility? Shouldn’t market volatility be the key to profitability? Well, the answer here is “no,” not all volatility is beneficial for trading.
For example, taking a trade at the end of the low liquidity New York trading session may result in short-term profitability, but it may not be sustained or serve as a predictor of the market’s next move. When liquidity is highest and the trend is better during the London market opening, you may consider breakout trading during the London opening. On your forex trading chart, pay attention to important times when major market participants may engage in significant buying and selling orders during key time periods.
As with everything in forex, there is actually nothing fixed here. Just because a breakout occurred during the relatively quiet Asian session does not mean it will automatically become a fake-out, as textbooks might suggest.
When you deposit funds into your forex trading account through Rockglobal, you can always keep up with forex trading times and market-moving news headlines, and access forex news terminals for free.
Trade now by depositing funds into your account.
In forex, you cannot buy or sell a single currency on its own; in fact, all trades are quoted and traded in pairs, hence the concept of forex currency pairs.
Now that we have a better understanding of the forex market, let’s take a closer look at the currencies that make up this massive market and how they are traded. We have discussed the size of the entire forex market, so now let’s delve deeper into the various currencies that make up this massive market.
Here is a list of the most popular and actively traded currencies in the forex market, along with the abbreviations used by traders:
• US Dollar (USD)
• Euro (EUR)
• Japanese Yen (JPY)
• British Pound (GBP)
• Australian Dollar (AUD)
• Swiss Franc (CHF)
• Canadian Dollar (CAD)
However, in the forex market, you cannot simply buy or sell these single currencies individually. In forex, currencies are actually quoted and traded in pairs, thus named currency pairs. This makes sense when you consider trading with real-world currencies rather than simply trading in notes of shares in companies or futures contracts. When you want to buy a specific currency, what will you use to pay for it? Of course, another currency. Hence the concept of forex currency pairs.
Here are the most commonly traded forex currency pairs:
• EUR/USD
• USD/JPY
• GBP/USD
• USD/CHF
• AUD/USD
• USD/CAD
Let’s take an example of a forex trade. Suppose your analysis tells you to buy EURUSD. This essentially means that you are buying euros and selling US dollars. Since each currency pair is essentially a relationship between two different quoted currencies, there are several different scenarios that can make your trade profitable.
In short, if the euro rises while the US dollar falls, you will profit. The currency pair relationship also means that if both currencies rise and the euro rises more, you will profit; if both currencies fall but the US dollar falls faster, you will also profit.
Make sure to log into your Rockglobal MT4 demo account and try trading different forex currency pairs to familiarize yourself with their relationship.
A currency pair is an exchange rate for a forex trade consisting of two currencies, represented by two ISO codes separated by a slash, such as GBP/USD, where the first code represents the “base currency” and the second code represents the “quote currency”.
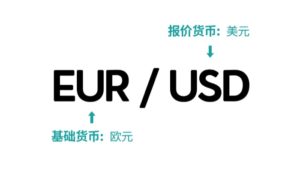
Here, we can see the different parts that make up a forex currency pair.
The first currency listed in the pair is called the base currency, while the second currency listed is called the quote currency.
Have you ever noticed that a certain currency pair is always written in a fixed order? For example, EUR/USD is always written with the euro as the base currency rather than the other way around. This is due to a universally adopted standard where each currency has a ranking relative to each other. If one currency has a higher ranking than another, it will be given the base currency status when quoted as a currency pair.
The universally accepted ranking order is as follows:
1. EUR
2. Pound Sterling
3. Australian Dollar
4. New Zealand Dollar
5. US Dollar
6. Chinese Renminbi
7. Swiss Franc
8. Japanese Yen
The ranking is determined by the relative value of the currencies at the time, but subjective insertions of new currencies (such as the euro) are made.
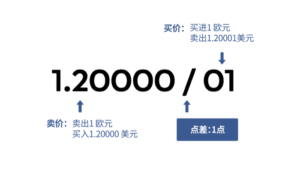
When displayed as a quote, a forex currency pair like the example in the left image shows the price of how much quote currency (in this case USD) is needed to buy one unit of the base currency (in this case EUR). For example, EUR/USD at 1.2000 means that one euro can buy 1.2000 US dollars.
In forex currency quotes, the first number is the so-called bid price, which is the price at which you can buy the currency pair. The second number is called the ask price, which is the price at which you can sell the currency pair. The difference between the bid and ask prices is called the spread, which is the price you must pay to enter a trade.
On Rockglobal MT4, check the quote board to see the base and quote currencies, as well as the minimum spread that Rockglobal can offer its traders.
When we read forex-related news or articles, we often come across confusing nicknames for currencies or currency pairs. Various currency nicknames can leave us puzzled, but behind these nicknames are historical stories.
Sometimes, when talking to other forex traders, you may hear nicknames that you are not familiar with.
“I want to buy 10 lots of Cable, what do you think?”
“Well, have you looked at Fiber? Its support looks like it might collapse altogether.”
Wait a minute, I thought we were talking about forex trading here? Though it may seem strange at first glance, these are actually nicknames for different forex currency pairs!
Let’s take a look at the two most frequently used nicknames for forex currency pairs, Cable and Fiber.
GBP/USD – Cable:
In 1858, a cable was laid across the Atlantic Ocean between the United Kingdom and the United States to transmit telegraph messages between the two countries. These cables are still used to transmit information for currency trading between the two countries, hence the currency pair is also known as Cable.
EUR/USD – Fiber
The origin of this nickname is disputed. Some say that the euro is made of pure cotton fiber paper to make it more durable, hence the nickname Fiber.
Others say that Fiber actually originated from Cable. The euro was introduced earlier than the pound/dollar pair, and Fiber refers to a newer, more modern form of Cable. Therefore, Fiber is used to refer to updated and more modern currency pairs, specifically the euro/dollar pair.
Of course, there are many other forex currency pair nicknames, such as:
AUD/USD – Aussie or Ozzie
NZD/USD – Kiwi
USD/CHF – Swissy
USD/CAD – Loonie
GBP/JPY – Guppy or Gopher
EUR/JPY – Yuppy
EUR/GBP – Chunnel
Log in to your Rockglobal MT4 account and find the currency pairs with nicknames. Now you don’t have to worry about communicating with other forex traders!
Currency pairs in the forex market can be roughly divided into four types: risk currencies, high-yield currencies, direct currency pairs, and cross-currency pairs.
Risk Currencies
Currencies that are highly volatile against the US dollar or other major currencies are considered high-risk currencies. The most common high-risk currencies are often emerging market currencies because they can experience sudden large devaluations in certain situations. (Typically: bullish sentiment among global investors)
High-yield Currencies
Currencies with higher interest rates in their respective countries may attract investors for carry trade opportunities in forex trading.
Direct Currency Pairs
Currency pairs related to the US dollar are direct currency pairs. For example, the US dollar against the Japanese yen (USD/JPY), or the euro against the US dollar (EUR/USD).
Cross-currency Pairs
Currency pairs that do not involve the US dollar are cross-currency pairs. For example, the euro against the Japanese yen (EUR/JPY).
In the fast-paced forex market, investors can make profits by going long (buying) or going short (selling) based on bullish or bearish sentiments. The unique nature of forex trading allows both long and short positions to be profitable.
Forex trading is a two-way trade, and naturally, there are two directions: long and short.
Bullish concept
Bullish concept refers to investors being optimistic about the stock market and expecting prices to rise. They buy at low prices and sell when prices rise to a certain level, in order to gain a profit from the difference.
A bullish market refers to a stock market with more buyers than sellers, indicating a rising trend in the stock market.
Bearish concept
Bearish concept refers to investors being pessimistic about the stock market and expecting prices to fall. They sell at relatively high prices and buy when prices drop to a certain level, in order to gain a profit from the difference.
People usually refer to the foreign exchange market with a long-term downward trend as a bear market, characterized by a series of large drops and small rises in prices.
Bull and bear are two opposite concepts. Simply put, investors who are bullish expect prices to rise, while investors who are bearish expect prices to fall. The special nature of bidirectional trading in the foreign exchange market allows investors to profit from both long and short positions, and investors must understand this.
Try to go long and short on a Rockglobal MT4/MT5 demo account.
When you trade forex online, you are trading with contract orders. You can use leveraged forex trading to maximize your investment benefits by using internationally standardized lot contracts.
Here is a list of common lot sizes and the corresponding number of currency units you are actually buying or selling.
・ 1 standard lot (STANDARD lot) represents 100,000 currency units
・ 1 mini lot represents 10,000 currency units
・ 1 micro lot represents 1,000 currency units
By default, Rockglobal’s standard STP and RAW ECN forex trading accounts are set to use standard lots for trading. At first glance, this may seem only suitable for large traders, but don’t worry, as the Rockglobal MT4/MT5 platform allows you to trade standard lots down to 0.01, providing you with the opportunity for small lot size trading to leverage wealth. By playing with small standard lots, traders of all levels can use a standard account to trade.
Next question: Do I need $100,000 for a forex trading account that only trades 1 standard lot? The answer is no. Forex traders here use leverage.
When you trade forex with leverage, you can actually control more funds than the balance of your own trading account. Using leverage can increase profits because you can trade larger volumes than non-leveraged investments allow.
At Rockglobal, the leverage for standard accounts is 500:1. This means that for every $1,000 in your trading account, you can actually control $500,000 in currency. You can borrow the leverage from your broker, which is $500,000, so that you can trade standard lots. Your $1,000 account is called a margin, and you can consider it as a deposit of trust when using that money to trade.
For example, suppose you have a balance of $5,000 in a standard STP trading account at Rockglobal and you are using leverage of 500:1. If you want to go long on 1 standard lot of EURUSD, Rockglobal will reserve $200 as margin and allow you to take that position.
This is an extreme example that highlights the risks of forex trading. If the “margin level” in your MT4/MT5 drops to 50%, your position will be automatically closed and you will need to add more margin to trade again.
In margin trading of Forex, the smallest unit is called “point”, and the “point value” is the value of each point of a currency pair. The minimum unit of exchange rate change is a point. For example, if the EURUSD exchange rate rises from 1.2250 to 1.2251, it has changed by one point.
The last digit of the Forex quote is the digit of the point, the second last digit is the digit of the ten points, and so on. The point value is used to calculate profit and loss. Since each currency has its own value measurement, it is necessary to calculate the value of a specific currency point.
In Forex margin trading, the point value means the value of each point of a currency pair. For example, if the point value of USDJPY is 0.09, it means that if an investor trades 1 standard lot of USDJPY and the USDJPY price fluctuates from 109.501 to 109.502, the investor will make a profit or loss of 0.09 US dollars.
The point value, as the name suggests, is the value of one point. In the case of trading one standard lot, the fluctuation of one point (regardless of the leverage multiple of the trading platform) is a fluctuation of 10 US dollars. Therefore, 50 points in one standard lot is a fluctuation of 500 US dollars.
The base currency refers to the first currency in a currency pair (in the case of EURUSD, it is EUR), while the quote currency refers to the second currency (i.e., USD).
Calculate:
1) 1. If the account is denominated in USD and USD is the quote currency (EURUSD):
Pip value = 0.0001 x units
Example: You have a $5,000 account and you buy 25,000 EURUSD (0.25 lots)
Pip value = 0.0001 x units
Pip value = 0.0001 x 25,000
Pip Value = $2.50
2. If the account is denominated in another currency (i.e., AUD) and USD is the quote currency (EURUSD):
Point value = 0.0001 x units / AUDUSD
Example: You have a $5,000 AUD account and you buy $25,000 EURUSD.
Pip Value = 0.0001 x Units / AUDUSD
Pip Value = 0.0001 x 25,000 / .7150
Pip Value = $2.50 / .7150
Pip Value = $3.50
Note that under the current market interest rate, the Pip value will be greatly increased if the account is denominated in AUD. This is very important to know when calculating stop loss.
3. If the account is denominated in USD and USD is the base currency (USDCHF):
Pip value = 0.0001 x units/quote
Example: You have a $5,000 USD account and you buy $25,000 USDCHF
Pip value = 0.0001 x units / quote
Pip Value = 0.0001 x 25,000 / USDCHF
Pip Value = $2.50 / .9915
Pip Value = $2.52
4. If the account is denominated in another currency (i.e., AUD) and USD is the base currency (USDCHF):
Pip value = 0.0001 x units / quote / AUDUSD
Example: You have a $5,000 AUD account and you buy $25,000 USDCHF
Pip Value = 0.0001 x Unit/Quote/AUDUSD
Pip Value = 0.0001 x 25 000 / USDCHF / AUDUSD
Pip Value = $2.50 / .9915 / AUDUSD
Pip Value = $2.52 / .7150
Pip Value = $3.52
If your account is denominated in USD and you are trading a non-USD cross currency, such as GBPUSD:
Pip Value = 0.0001 x Units x Quote currency rate (GBPUSD).
Example: You have a $5,000 account and you are long 25,000 EURGBP (0.25 lot)
Pip Value = 0.0001 x Unit x GBPUSD
Pip Value = 0.0001 x 25 000 x GBPUSD
Pip Value = $2.50 x 1.4350
Pip Value = $3.59
If your account is denominated in AUD, you will need to divide the final USD Pip value by the AUDUSD exchange rate or use GBPAUD instead of GBPUSD as the quote currency rate
Note that for currency pairs such as EURCHF, the quote currency cannot be used as CHFUSD, so you will use 1/(USDCHF) as the quote currency rate. In addition, for some currency pairs, a multiplier other than 0.0001 must be used (e.g., if JPY is the quote currency, the multiplier is 0.01).
Want to try calculating pip values? Quickly use the Rockglobal RAW ECN demo account to operate.
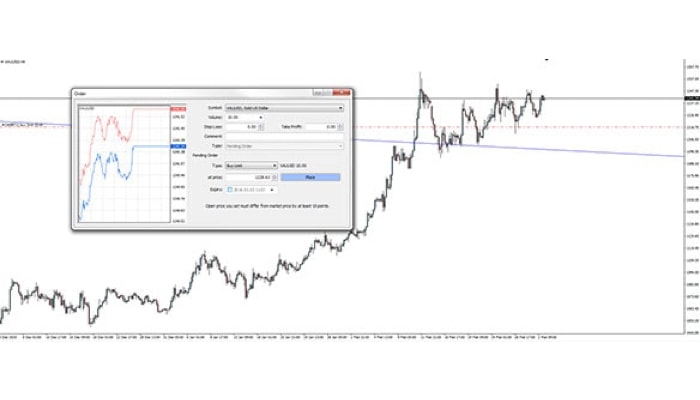
Orders represent your entry or exit into a trade. When you trade forex, whether now or in the future, you can use options to get a trading opportunity rather than just buying and selling at current market prices. Here, we will introduce your options.
Market orders can be buy or sell orders entered at the current market price. That’s the price you see on the MT4/MT5 chart right now. If you enter a market order, you will enter at the best available price immediately.
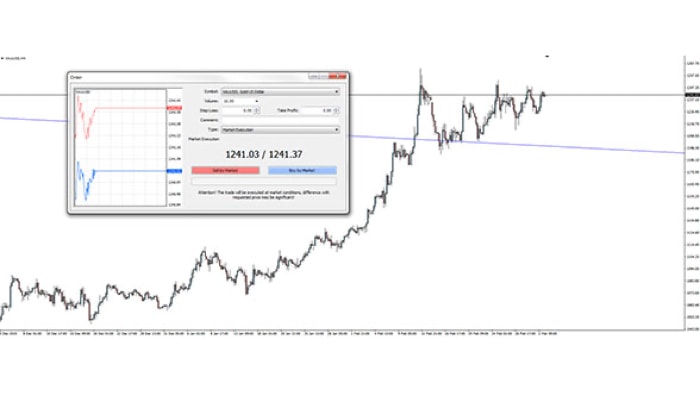
When you see a trading opportunity that requires you to act quickly, it’s best to use a market order. Click buy/sell in the market and you can trade immediately. For example, the buy price of AUDUSD is currently 0.7228 and the sell price is 0.7230. If you want to go long on AUDUSD in the market, your buy price is 0.7230. You click to buy and your Rockglobal MT4/MT5 platform will execute the purchase order at that exact price.
Stop orders can be stop buy or stop sell orders used when you want to buy above or sell below the market price. This is quite suitable for reference line breakouts or trend continuation strategies when you are optimistic about the continued development of the market.
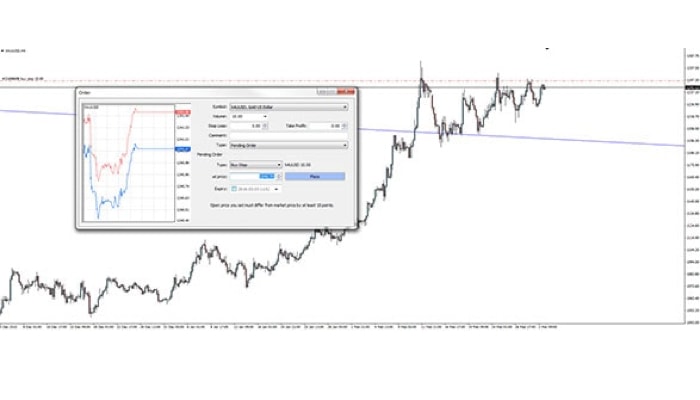
For example, the current trading price of AUDUSD is 0.7230 and is trending upward. Assume you think the price will continue to rise and break through the resistance level of 0.7300. At this point, instead of sitting in front of your computer worrying about missing the ideal entry price, you can set the stop buy at 0.7300, and when the price hits the stop order, the order will be executed automatically.
On the other hand, if you think the price will reverse at a certain level, you can use a limit order. Limit orders can be limit buy or limit sell orders, depending on the market’s trend before the expected reversal. Limit buy is used for prices lower than the market price, and limit sell is used for prices higher than the market price. For example, the current trading price of AUDUSD is 0.7230,
For example, the current trading price of AUDUSD is 0.7230. Your analysis tells you that the resistance level is at 0.7300, and you hope to go short when the price reaches that level. You can sit at the exchange and wait for the price to rise to 0.7300 and sell in the market, or you can use a sell limit order.
The best way to understand different types of forex orders is to try using them under real trading conditions in a Rockglobal MT4/MT5 demo account.
Rollover is the interest fee paid or received by you at the end of each trading day. In margin trading, you will receive interest on long positions or pay interest on short positions. The net interest difference is called an arbitrage trade, and traders who seek to profit from it are called arbitrageurs.
When the interest you receive exceeds the interest you need to pay, a positive arbitrage result is generated and added directly to your account. If it is less than the interest you need to pay, the difference will be deducted from your account. If you open and close a position on the same day, the trade does not involve interest.
If you are interested in arbitrage trading, the first step is to find currency pairs with high and low yields. Examples of low-yielding (or funding) currencies are the Japanese yen (JPY), Swiss franc (CHF), and euro (EUR). As for high-yield currencies, the Australian dollar (AUD) and New Zealand dollar (NZD) are popular, although more advanced arbitrage traders may choose the South African rand (ZAR) or other foreign currencies.
Let’s take the euro and the US dollar as an example. The interest rate in the euro area is currently below zero, while the interest rate in the US is relatively high, currently at 2%. This means that there is an opportunity to make an arbitrage by buying AUD with euros, that is, going short on EURAUD. It’s simple, right?
However, if you can’t make a weekly profit of at least 100 points from currency trading, earning one point a day doesn’t make sense for you. In other words, if we want to arbitrage EURAUD, it is best to wait for the currency pair to trend downwards and then sell, profiting from the duration of the downward trend.
We can view rollover as an extra reward or incentive for holding a long-term trade (while being careful of negative rollover).
If you want to profit from arbitrage trading in the long run, open a Rockglobal real account and start trading now.
When you trade crude oil (CL-Oil) on the MT4/MT5 platform, you will encounter overnight interest if you hold a position within the expiry date of the futures contract on which the price is based. If you do not want to be charged a rollover fee, you should close your position in advance.
Because Oil (CL-Oil) is a futures contract with a set expiration date, if you want to continue holding a position before the expiry date, you must close the old position at the contract expiration and open a new position on a new futures contract.
Example of oil rollover:
For a 10-barrel CL-OIL trade at a price of $98.50, with a difference of +50 points ($0.50) between each monthly contract, the calculation is as follows:
Long position: (10 x -0.50) + (-0.04 x 10) + ((10 x 98.50 x -0.002 x 1)/360) = -$5.41
Bullish: (10x + 0.50) + (-0.04 x 10) + ((10 x 98.50 x -0.002 x 1) / 360) = +$4.59
All crude oil futures adjustments are calculated in the currency used by that commodity. If your account is denominated in another currency, your account will be converted at the current market rate.
The number of positions you open and the leverage ratio determines the risk you need to bear. Develop an investment strategy carefully to avoid adding margin and forced liquidation.
Forex traders can use a small amount of capital to open trades several hundred times the size of their account balance, achieving incredible profits. However, leverage is a double-edged sword, with enormous profit potential as well as loss risk. If your position size is too large or too many, opening leverage will not be beneficial to you, and you may face the situation of adding margin and forced liquidation, resulting in only a small portion of your original balance remaining. So, how to avoid adding margin and forced liquidation?
Position adjustment
Ensuring the safety of position risk, the calculated position size is closely related to successful forex trading. Before entering a trade, you should determine where you will place your stop loss and how much risk you have on the position – how far the stop loss distance from the entry, and how much risk per trade determines the size of the position. Instead of determining the stop loss or risk per trade based on the size of the position.
Some educational institutions and experts will tell you that each trade can lose up to 5%. On the other hand, most professional traders will tell you that the risk of a single position is too great. Imagine you are trying to keep the loss ratio below 20%: if you have a risk of 5% per trade and lose 4 trades in a row, you have reached the loss tolerance. The more money you withdraw from your account, the more difficult it is to make a profit. Large losses are also difficult, and you may engage in revenge trading or open larger positions to try to make up for the losses (this is not trading), which turns your trading into gambling.
Generally speaking, the risk of any single trade should not exceed 2% of the account balance. If you are just starting out, 1% may be more appropriate. Once you have learned to control the loss ratio and are confident in yourself and your strategy, then you can consider increasing the position slightly. Whichever way, 5% may be too much for most strategies. Even the best professional traders may experience losses in more than 4 trades.
If you want to trade larger positions, you should properly fund your account. This is the only safe way to engage in large-scale trading.
Position quantity and correlation
The number of positions you open determines your risk at any time. If you open 10 positions at the same time with a 2% loss risk per trade, you will definitely receive a notice of adding margin, so maintaining moderate trading can bring more profits.
There is also a situation where you only open two positions but are trading in a market with extremely high volatility, and in fact, each trade still carries a 4% risk. For example, the risk of long AUDUSD position is 2%, and at the same time, the risk of long NZDUSD position is also 2%. If the two currencies are highly correlated, the risk of the two positions combined may be higher than 4%.
On the other hand, do not trade in the opposite direction in highly volatile markets, even if your risk is zero. For example, in the case above, besides going long AUDUSD and short NZDUSD, the USD component cancels out theoretically even if you hold a long position in the Australian dollar and a short position in the New Zealand dollar. However, related markets may not always follow the trend. During high volatility periods, the market can have rapid and drastic fluctuations in both directions, triggering two stop-loss pips.
Usually, you should not open two or three or more positions simultaneously, and you should avoid trading in highly volatile markets, or at least be aware of the risks.
Margin calls and forced liquidation
If the net value in your account falls below 50% of the margin, your position will automatically be closed, and your floating loss will be very large. This is called a “margin call” in the trading circle, and you will only be left with a small portion of the original balance. The remaining amount depends on the leverage used and the number of positions opened. If you have many open positions, they will not all be closed simultaneously, but gradually. This means that you may only have a few dollars left in your account. Pay attention to avoid a “margin call” situation when trading.
Trade management is your responsibility
Although we can provide you with knowledge and guidance in risk management and notify you when your net asset value is too low, ultimately, managing the position size and ensuring there is enough funds in the account is your responsibility as a trader. Rockglobal offers its clients a lot of leverage, so our clients can trade freely in a way that suits them and execute any trading strategy. For example, most scalping strategies require a lot of leverage even if they only take on 1% or 2% risk. If you don’t scalp, you don’t actually need too much leverage and can consider setting the leverage to 50:1 or 100:1.
Using leverage correctly is the fastest tool to make profits, but the speed of making profits requires you to have strong management skills over your own trading, and managing trades is your responsibility.
Risk management is an essential requirement for profitable and successful trading
When you trade with a leverage ratio that suits you, limit the risk of each trade to no more than 2%, set appropriate position sizes, and do not open more than two positions at a time, you will almost never receive a margin call. Proper risk management is the difference between successful trading and gambling. With perfect risk management, you can easily become a profitable and successful forex trader.
Trading forex requires you to identify your advantages: choosing the market trend correctly and trading with a profit greater than the loss. Successful forex traders usually have both.
When trading forex currency pairs, two things can happen: the price can rise or fall. As a trader, your job is to correctly identify the trend. Both possibilities are basically 50/50 chances. The problem lies here: how do you make money if you win, lose, win, lose?
When trading forex, you need to identify your advantage. Either you can correctly identify the market trend for more than half the time (this is called a positive win rate), or each trade has a profit greater than the loss (called a positive risk-reward ratio). Successful forex traders usually have both, not only do they often choose the correct direction of the market trend but also the profit from the winning trades outweighs the loss from losing trades.
This is an example of a 1:2 trade – we are long EUR/USD, risking 80 pips to potentially make 160:
Note we could actually squeeze 1:3 out of this range:
If making 1:3 trades, you only have to be right 25% of the time in order to break even.
If you want to make money trading Forex you have to have some form of edge. Find your trading edge with Rockglobal.
The biggest and most obvious part of fundamental analysis is trading economic data releases, or more simply as traders call it: News trading.
So that everyone in the market has a level playing field when it comes to market sensitive news, each economic data release has a set time and date that it must be released. This means that at this particular time EVERYONE is watching and trading that particular Forex market. All this attention leads to volatile market conditions as everyone tries to outwit each other in the race to best position themselves.
There are literally hundreds of economic data releases every single day. Think about it. Every single country in the world releasing data such as unemployment, retail sales, GDP, trade balance. The list goes on forever. But just because a piece of economic data is released, doesn’t mean that it is relevant to you and your trade!
Our economic calendar allows you to filter news releases by both country and expected market impact, making sure you’re only focusing on the news that is most relevant to you and your particular Forex trade.
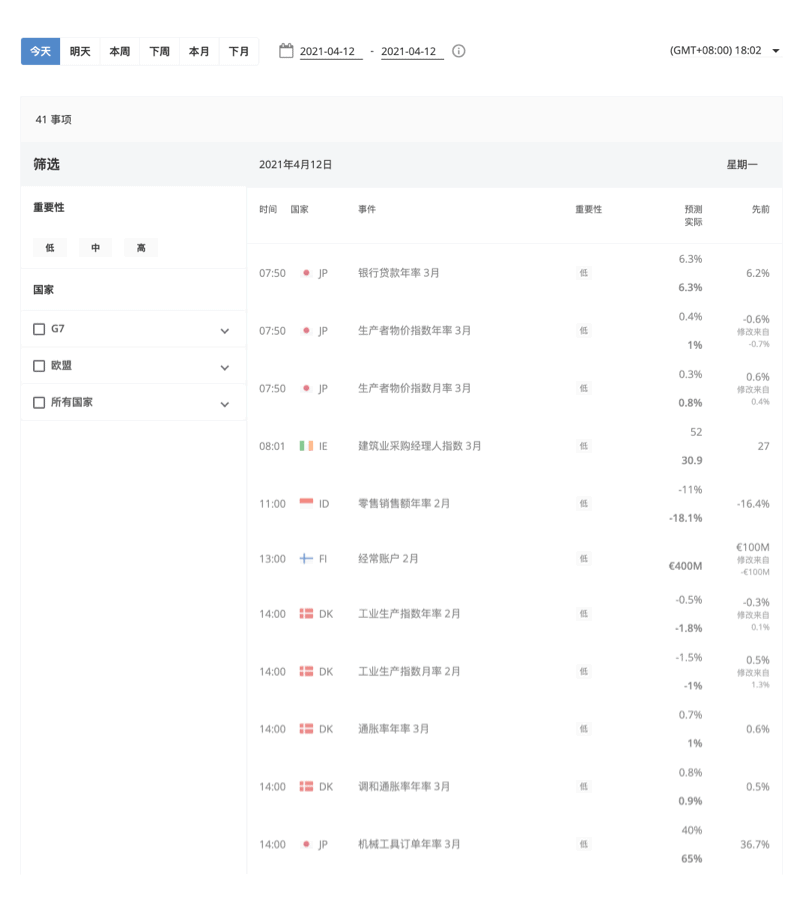
If you are trading EUR/USD, then the GDP of South Africa contracting shouldn’t really have too much of an effect on either the Euro or the US Dollar, should it? Of course not.
But on the other hand, a big and unexpected drop in the tier 1 US unemployment rate could have catastrophic effects on not only USD Forex pairs, but across the entire Forex market. This is because the US economy is still the biggest and weakness at the top of today’s interconnected world so easily sends shockwaves through the entire world. Do you remember the GFC?
Did you know:
“The US Non-Farm Payroll report is one of the most significant pieces of economic news on the Forex calendar. NFP, as traders refer to the release, is the monthly change in the number of employed people in the US economy with farming excluded. It is a major barometer for the health of the US economy and in term the globe.”
So where can you stay up to date with the most important economic data releases?
The Rockglobal Forex Economic Calendar.
Our Forex economic calendar should be the first point of call for all traders starting their morning routine. As outlined above, the calendar can be fully customised and filtered to only show you the scheduled Forex data releases most important to you and your trades.
To achieve certain economic mandates or goals, a country’s most potent weapon is monetary policy. Monetary policy is determined by a country’s central bank acting independent from government (unless you’re China of course!).
Monetary Policy is the process of setting the interest rate and controlling the supply of money.
There are three main goals that monetary policy helps a central bank achieve. Those being:
・ Economic growth targets.
・ Inflation in the target band.
・ Low unemployment.
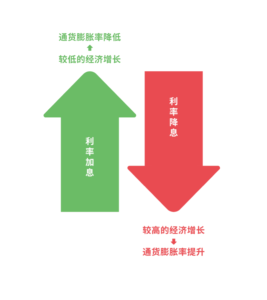
Now we have gone through what monetary policy is, let’s go one step further. Have you ever heard monetary policy referred to as being Hawkish or Dovish? No, economists aren’t watching birds or performing magic tricks, they’re actually describing the types of monetary policy that central banks have at their disposal.
Hawkish monetary policy is indicative of rising interest rates. It is sometimes referred to as tightening because essentially the central bank is looking to tighten the economy and slow it down in the wake of higher inflation.
Under a hawkish scenario where interest rates are rising, the borrowing of money by both business and consumers becomes more expensive (due to higher interest repayments) so spending and investment decreases as a result.
Dovish monetary policy is the opposite, and indicative of falling interest rates. A central bank may decide to loosen monetary policy by cutting interest rates with the goal of stimulating a stagnating economy in mind.
Under a dovish scenario where interest rates are falling, money is being made cheaper and more accessible to business and consumers which encourages them to invest or spend. This spending then stimulates a stagnant economy.
By using the different types of monetary policy, a central bank can somewhat control, and in the end smooth the wild swings between the good and bad times experienced by an economy. Both economies and markets want stability and there is no point in experiencing huge booms if they are followed by equally as devastating busts in a regular business cycle.
Forex traders use charts to determine market direction and identify possible buying and selling opportunities. There are three types of charts commonly used in Forex that you can flick between on MT4:
・ Line chart;
・ Bar chart;
・ Candlestick chart.
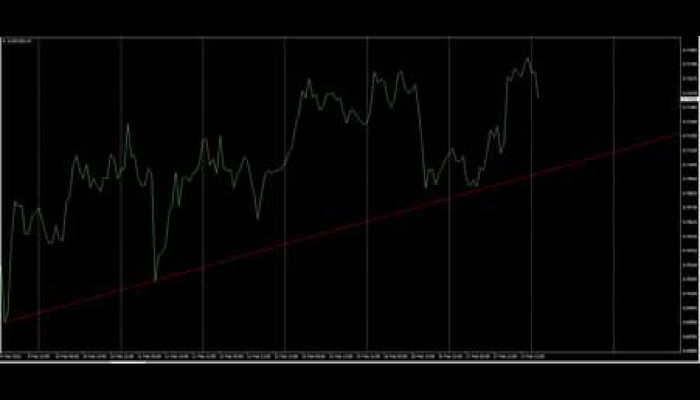
Line Chart:
These charts are handy for quickly determining the trend – only the current/close price is graphed – as such these charts should not be used for placing stop loss or take profit orders.
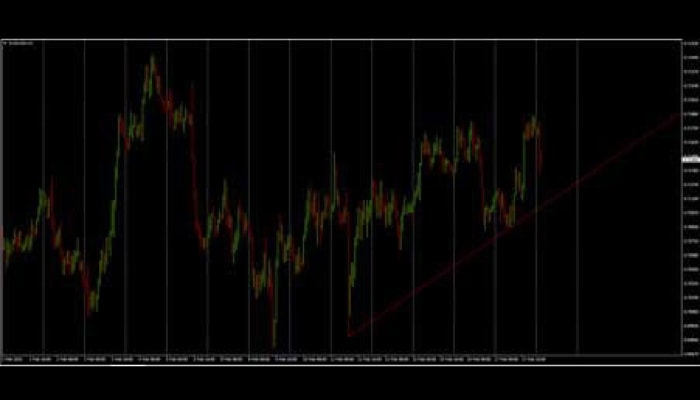
Bar Chart:
The chart is created with the use of bars where each bar has a high (top) and a low (bottom) with a line on either side; right side being the opening price and the left side being the closing price for the selected time period
Different colours can be used to identify bars that close higher than the open (bull or up bars) or lower than the open (bear or down bars). The example above has green lines for up bars and red bars for down bars. These charts show all the information you need but most traders and analysts tend to favour the third option – Candlestick charts.
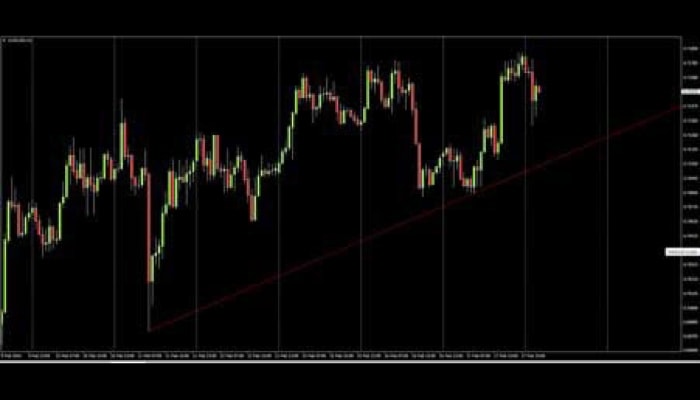
Candlestick Chart:
This chart is created much like bar charts, with the only difference being that candlesticks add dimension and colour to the Bar Chart by depicting the area of the bar between the open and close as a two dimensional real body.
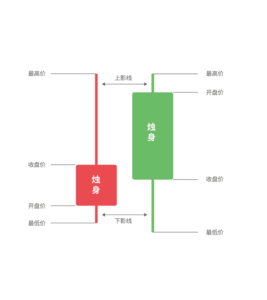
Candlesticks are comprised of a body which represents the difference between the open and close prices. An up candlestick occurs when the close is higher than the open – and down candlesticks occurs when the close is lower than the high. In the chart example above, up candlesticks are green whilst down candlesticks are red. If the open is equal to the close there will not be a body, just a line – this type of candle is referred to as a “Doji”.
The thinner lines extending beyond the body are called ‘Wicks’ – above the body is the high and below the body is the low for the selected time period. A large wick (relative to the body), indicates a potential turning point (support/resistance).
Which type of chart do you prefer trading off? Flick between the three on your MT4 Forex demo account.
In this section we’re going to take a look at trading off Forex candles on your MT4 charts. There are many different Forex candle patterns – we’ll have a look at some of the more common and reliable ones here. Candle patterns often indicate a turning point or reversal in the Forex market, so we’ll break this section up into ‘Bearish Reversal Candles’ and ‘Bullish Reversal Candles’.
Bearish Reversal Candles
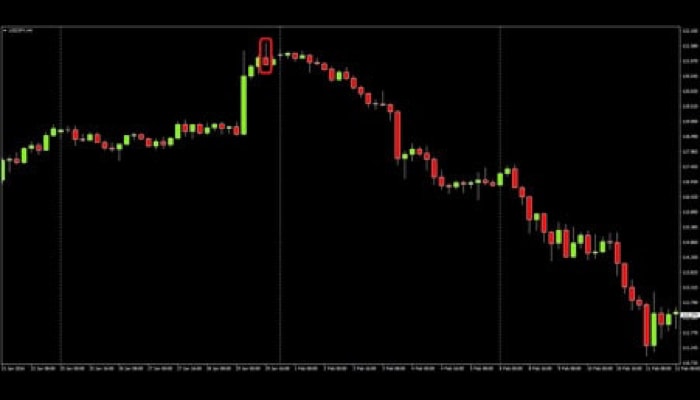
Shooting Star:
p>The Shooting Star is a single candle bearish reversal pattern that occurs at the end of an uptrend. Price initially moves higher, before eventually closing near the open, leaving a long wick with a short body. Wick should be at least 1.5x the length of the body. Note in the above example, this Forex candle leads to a decline of nearly 1000 pips in less than two weeks.
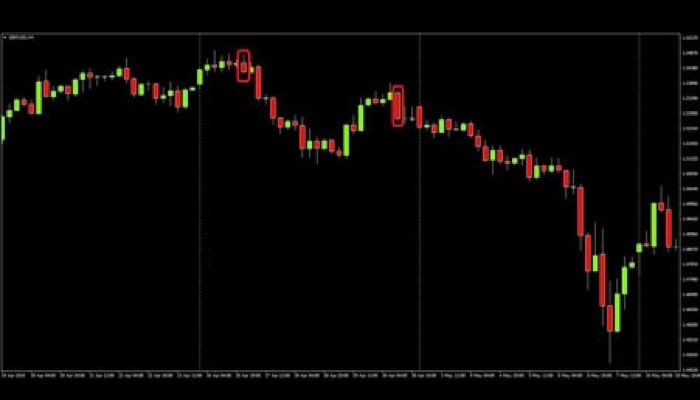
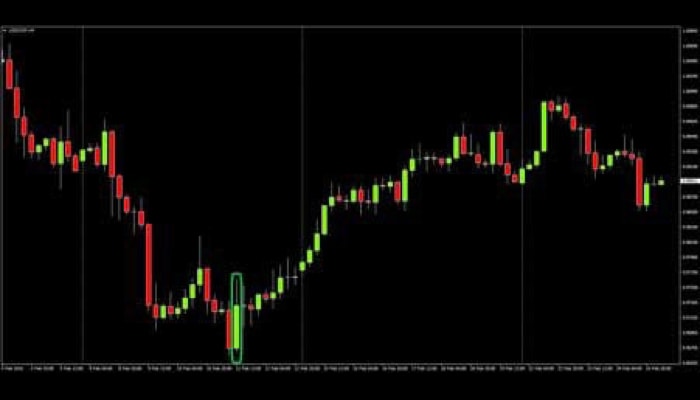
Bearish Engulfing:
The Bearish Engulfing is one of the more common bearish reversal and continuation patterns. The candle will close lower, with a body that completely engulfs the body of the relatively smaller previous candle. Note this candle continues to occur frequently throughout the down trend, signalling continuation (we have only circled two which occur at peaks).
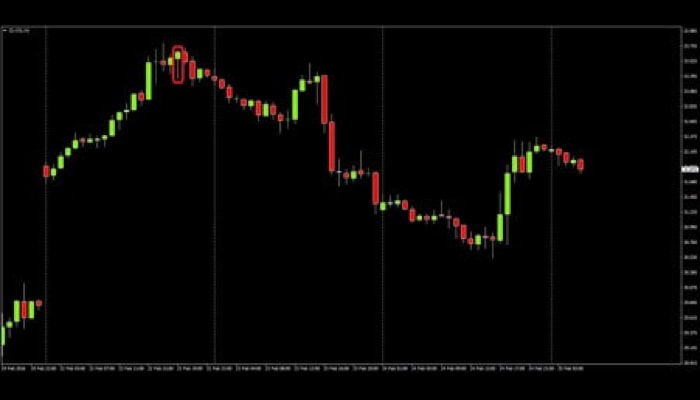
Hanging Man:
The Hanging Man is another relatively common bearish reversal candle that occurs at peaks. Price will move signifcantly lower at the start of the perioid but will come back to finish near the open, leaving a long wick and small body (simmilar to the Shooting Star, but the wick is below the candle not above). If this Forex candle occurs in the lows of a down trend it is a bullish candle known as a hammer.
Bullish Reversal Candles
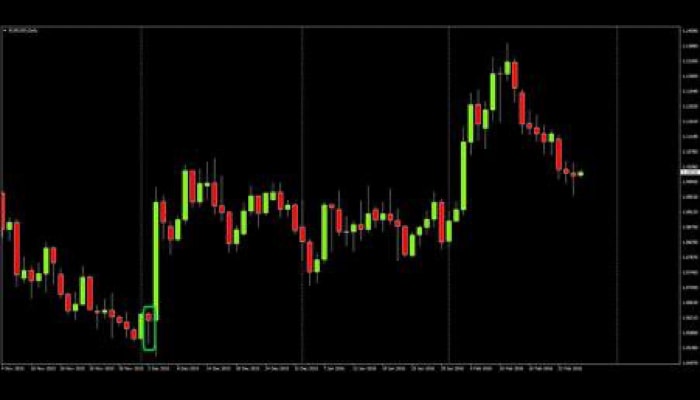
Bullish Hammer:
The Bullish Hammer is a common reversal pattern that looks identical to the Hanging Man candle but occurs in the bottoms of down trends. Price will move signifcantly lower at the start of the perioid but will come back to finish near the open, leaving a long wick and small body. Note in this example, the following candle actually breaches the Hammer’s low – Forex traders should always set their stop a reasonable distance from any reversal candle.
Bullish Engulfing:
The Bullish Engulfing is identical to the Bearish Engulfing but it is an up candle occuring at the end of a down trend. The body of the new candle will completely engulf the previous candles body signalling a major shift in sentiment.
These are just a few of the more common Forex candle patterns with high success rates. Remember some candles appear identical so you have to then determine whether the candle is appearing at a peak in an advance (Hanging Man) or at a trough in a decline (Bullish Hammer)?
Don’t forget to set your stops a safe distance from the relevant candle’s high/low – though many reversals are immediate, there is some times noise which you should adjust for.
Go back on your MT4 charts and see how many of each Forex candle pattern you can find and come up with a trading strategy around them.
In this section we will cover chart patterns, these are patterns that are comprised of many candles and take considerably more time to form. Once again, there are multitudes of chart patterns to draw up on your MT4 platform, so we will try to only cover the more common and reliable patterns.
Head and Shoulders – Bearish Reversal Pattern
This is by far one of the most common and easy to recognise chart patterns, it is also the most reliable. Forex traders love these patterns for both their reliability and the fact they offer clear entry and stop loss levels:
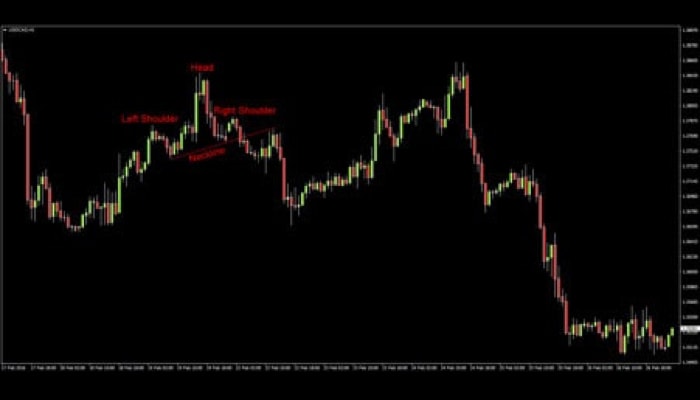
These patterns have four components:
Left Shoulder – small rounded top. Pattern is not yet visible
Head – Pair breaks above the left shoulder before retracing 100%, or the majority of the ascent – potential pattern visible to the keen eyed chart trader
Right Shoulder – pair forms a lower high to the right of the head, usually similar magnitude to left shoulder, but variance is not uncommon. Head and Shoulders top is now clearly visible.
Neckline – Though the chart pattern is now clearly visible, it is not a confirmed top until there is a break below the neckline. The Neckline connects the lows of the left and right shoulders. This is often a straight line, though in the above example it is ascending – patterns with ascending necklines are even more reliable than the standard, flat neckline Head and houlders.
Once price breaches the neckline, the trader enters short. Stop can be placed above the right shoulder, or above the head (depending on your risk tolerance). Note that price often comes back to test the underside of the neckline – this can be very handy if you’ve missed the original break and reinforces bearish bias. In this example, once price breaches the neckline, there is a ecline of over 100 pips.
Deformed Head & Shoulders – the above example was very clean, though some times, these patterns can exhibit ‘deformities’ such as dual or multiple right shoulders, descending neck lines or shoulders that exceed the top.
Cleaner patters tend to be more reliable, though the key to a successful trade is always waiting til the pattern is confirmed ie the Neckline breaks. Here are some examples of the above deformities:
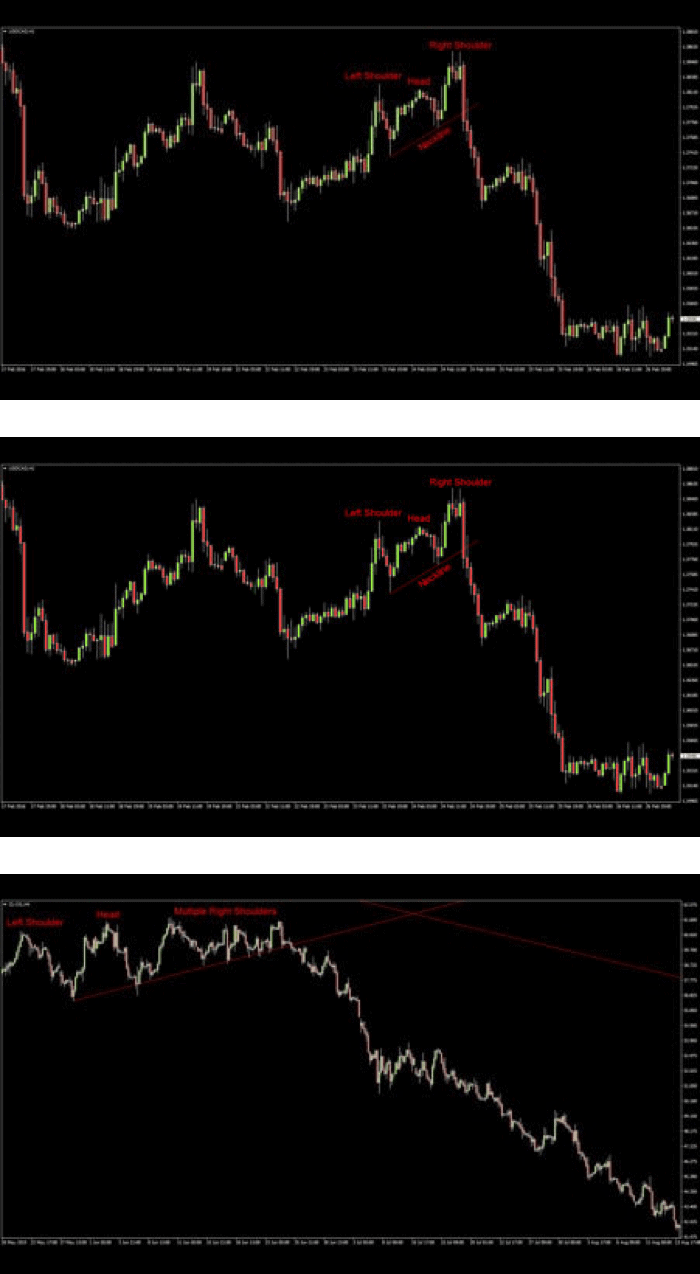
Head and Shoulders patterns are extremely reliable and offer the trader clear entry and exit points, but always remember – the setup is not confirmed until the neckline is breached.
Inverse Head and Shoulders – Bullish Reversal Pattern
As the name suggests, these patterns are identical to a standard Head and Shoulders, but appear upside down (on their heads) and signify a potential bottom. Not quite as reliable as the standard H&S, but still a very reliable pattern. These patterns are often more difficult to spot than their bearish counterparts, but recognition becomes easier as you gain charting experience.
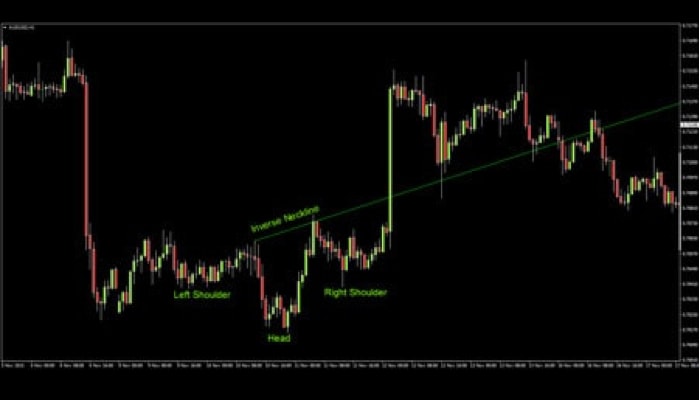
Once again, the key here is waiting til the neckline is breached.
Double Top – Bearish Reversal Pattern
The Double Top or ‘M’, is another reliable chart pattern favoured by many traders. Like the H&S, it offers the trader clear entry and stop loss levels. With the Double Top, the entry trigger is known as the Confirmation Line:
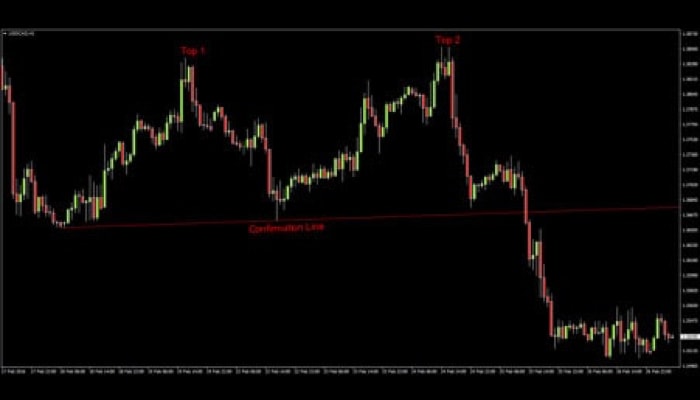
The Double Top is characterized by two tops of similar magnitudes, originating from roughly the same point. The Confirmation Line connects the two origin points and tends to be flat or ascending at a slight gradient. Just like the H&S, the trader does not enter short until the Confirmation Line is breached and the top is confirmed. Note the two tops often take the shape of H&S or smaller double top patterns (this M features the two H&S examples from earlier).
Double Bottom – Bullish Reversal Pattern
The Double Bottom or ‘W’ is the inverse of the Double Top – it’s shape is reminiscent of the letter ‘W’ and the pattern signals a potential bottom.
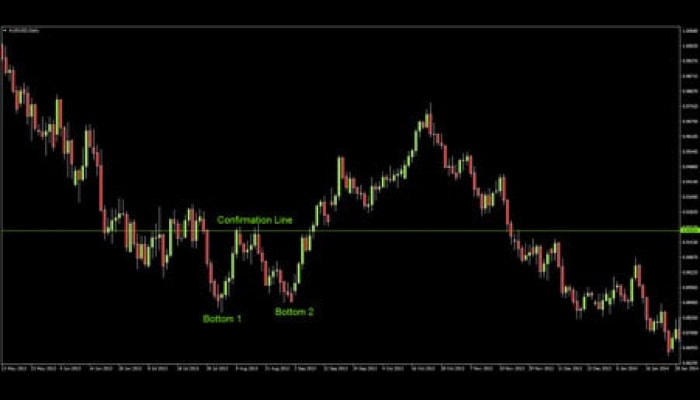
As with the other reversal patterns we’ve covered, the trader waits until the Confirmation Line is breached before entering a Buy position.
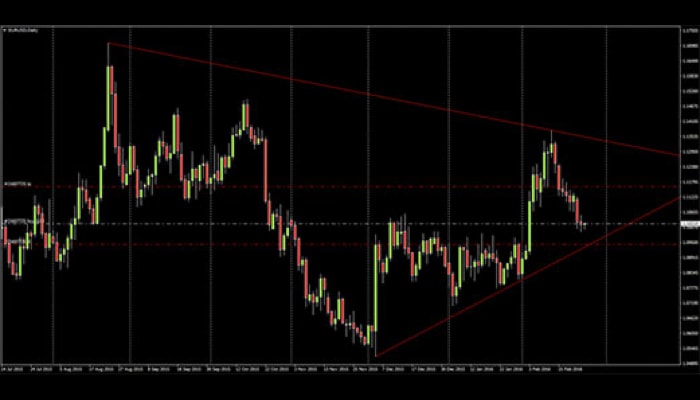
Ascending Triangle – Bullish Continuation Pattern:
The Ascending Triangle is one of the most reliable bullish continuation or accumulation patterns. It is characterized by a series of higher lows failing at a flat top – this means it is a ‘terminal’ pattern – eventually price will have to stop carving higher lows, or more often than not, the top will have to break.
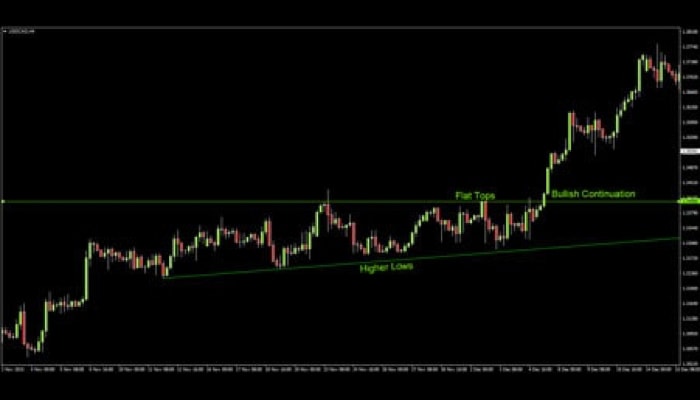
Just like the reversal patterns discussed in the previous section, the buy signal occurs when the top breaks and the pattern is confirmed.
Descending Triangle – Bearish Continuation Pattern:
The Descending Triangle on the other hand, is a very reliable bearish continuation pattern. The pattern is characterized by a series of lower highs meeting a flat bottom.
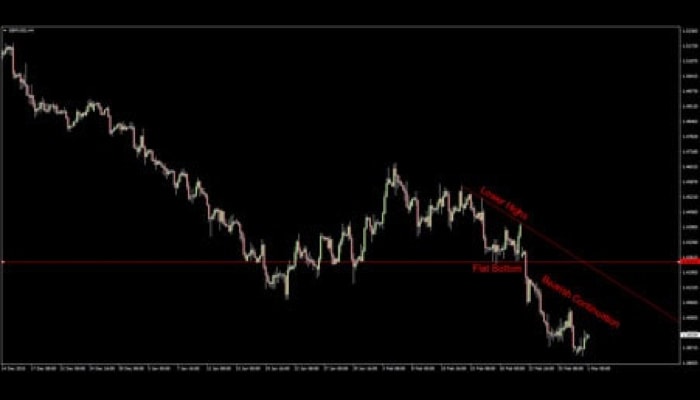
Traders will enter short when the flat bottom is taken out. As we discussed in the Trend Trading section, price can decline quite quickly in a bear market – these patterns often yield impressive moves lower.
Bull Flag – Bullish Continuation Pattern:
Bull Flags or Pennants are an extremely reliable bullish continuation pattern. They are deceptive to the novice trader as price is temporarily trending down, but at a relatively shallow pace. Bull flags are characterized by a series of parallel lower highs and lower lows within a dominant uptrend:
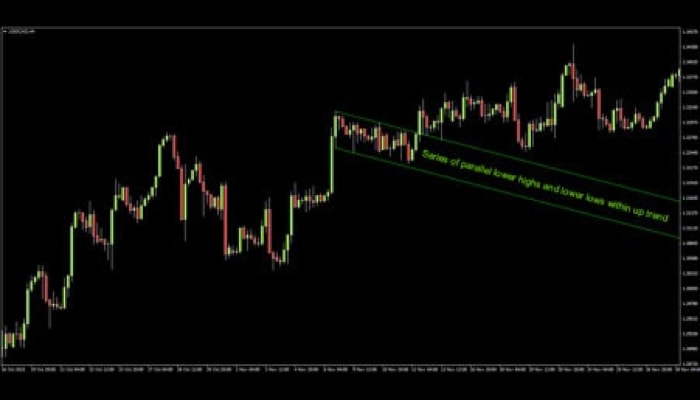
A buy signal is triggered when the upper parallel is breached.
Bear Flag – Bearish Continuation Pattern:
The last continuation pattern we will look at is the Bear Flag. The opposite of the Bull Flag, characterized by a series of parallel higher lows and higher highs within a dominant down trend:
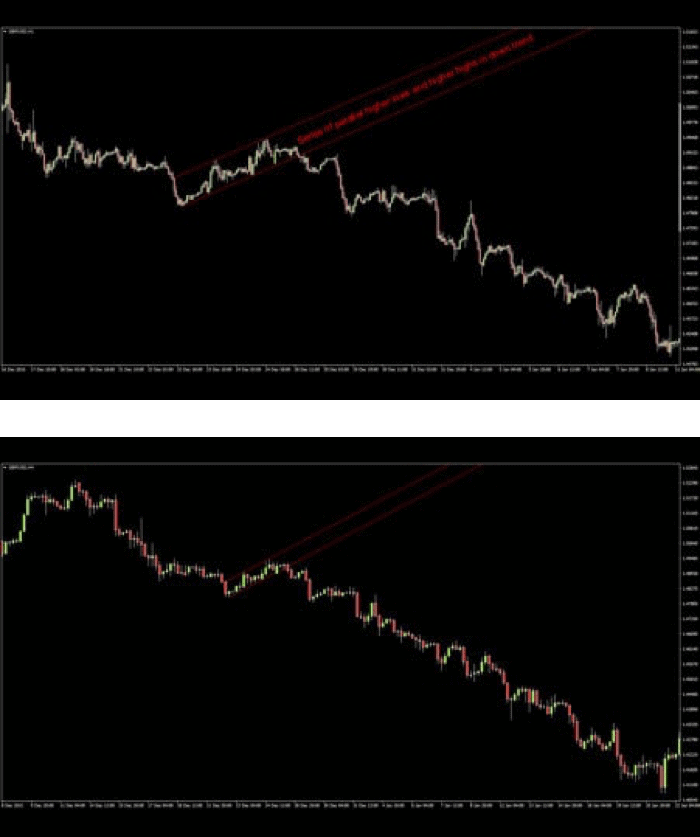
Traders will look to enter short once the lower parallel breaks. Just like the Descending Triangle, these patterns can lead to some fierce bearish continuation – in this case, GBPUSD declines over 800 pips in less than a month.
The Take Away: Chart patterns are often high probability, high reward trades that offer the trade clear entry and stop loss levels. Patterns are confirmed when the relevant line breaks – not before – wait for the breakout.
In Forex trading, support and resistance refers to levels where price is likely to pause, bounce or even reverse. Support is a lower price point or zone where the currency pair is considered ‘cheap’, spurning buying interest. Resistance is an upper price point or zone where the pair is considered ‘expensive’ and is likely to encounter sellers:
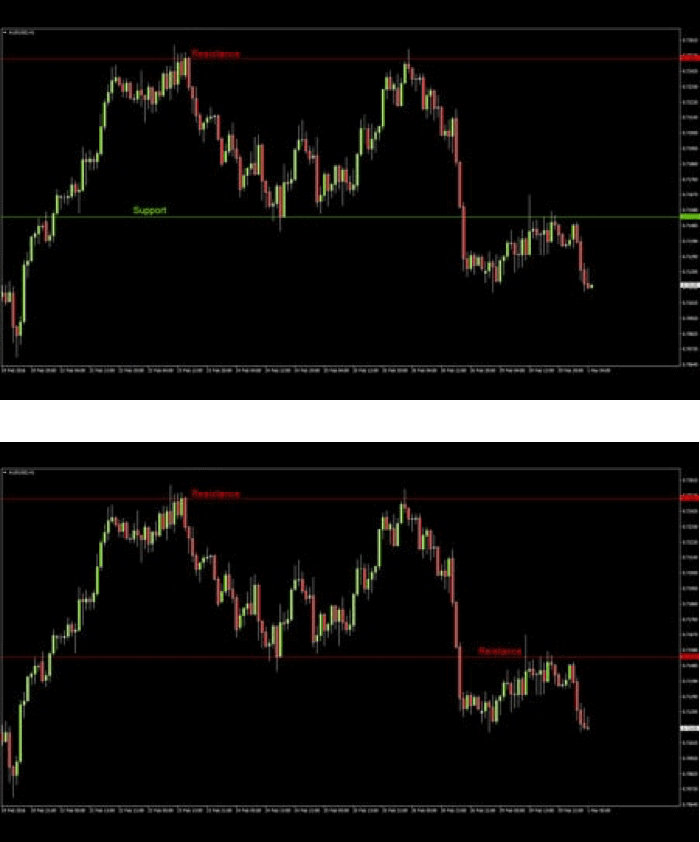
In the above example, the Australian Dollar is finding buyers around 7150, but encountering strong selling interest above 7250 – note pair spikes above 7250 resistance five times, but is unable to close above there. It is also worth noting that when there’s an hourly close below 7150 support, pair is then unable to close back above the level – former support is now acting as resistance:
This is a fairly common occurrence in Forex trading – levels that previously encouraged buying interest will nearly always encourage selling interest after they break down (and vice versa).
You’ve heard the old saying “Buy Low, Sell High”? Forex traders look to sell into resistance and buy into support, this leads to higher probability setups, allows the trader to set tight stops and leaves plenty of room for rewarding trades.
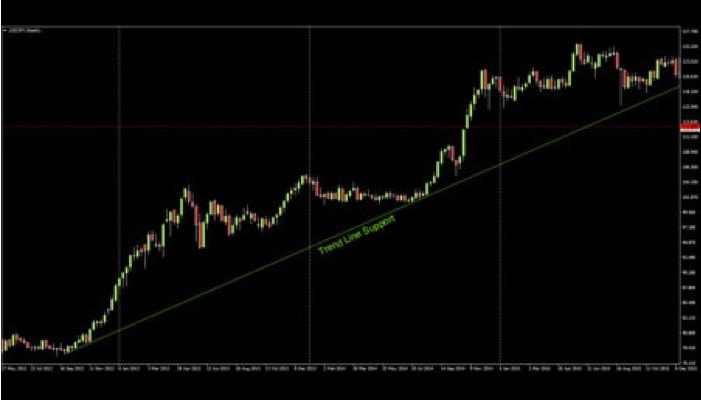
Now we’ve had a look a horizontal support and resistance, let’s take a quick look at trend resistance and support:
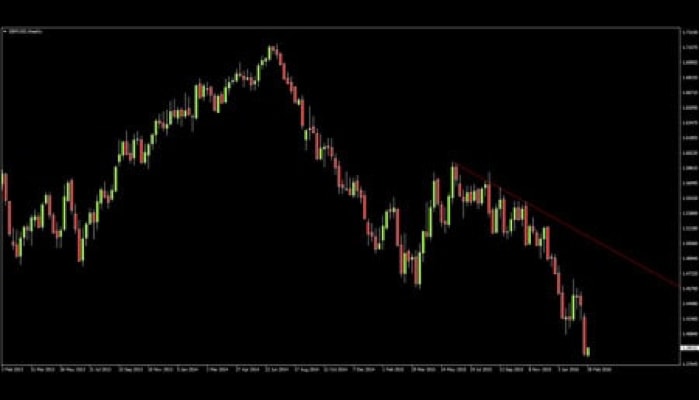
This is the trend line that supported USDJPY from September 2012 – January 2016. Note pair finds buying interest whenever price nears trend support.
Here we have the recent down trend in GBPUSD, note pair is unable to close the week above trend line resistance and eventually turns lower.
Remember: If you want high probability, rewarding setups – Buy low, sell high – buy into support, sell into resistance.
Fibonacci retracements are a quick and easy way of predicting support and resistance levels in Forex. The Fibonacci tool works on the principle that markets tend to ‘retrace’ a portion of a move prior to continuing the dominant trend. Traders use the Fibonacci tool on MT4 to connect the lows and highs of a recent trend, swing or range and the tool displays likely support and resistance levels derived from the Fibonacci Sequence (Golden Ratio). Fibonacci levels appear again and again in Forex – this tool is surprisingly reliable when it comes to predicting support and resistance:
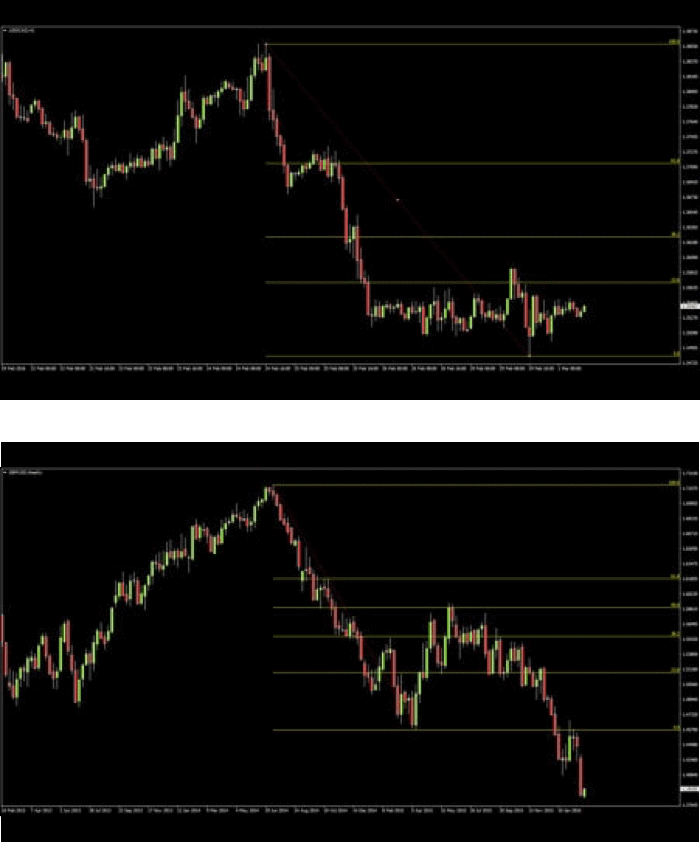
This is the recent down move in USDCAD. If we use the Fibonacci tool to connect the previous peak to the range low, we are shown three potential resistance levels. The standard Fibonacci retracement levels are 23.6, 38.2 & 61.8, but many traders also use the 78.6 and 50 levels. 50 is not actually derived from the Fibonacci sequence, but the importance of the level cannot be denied – 50% retracements are very common place:
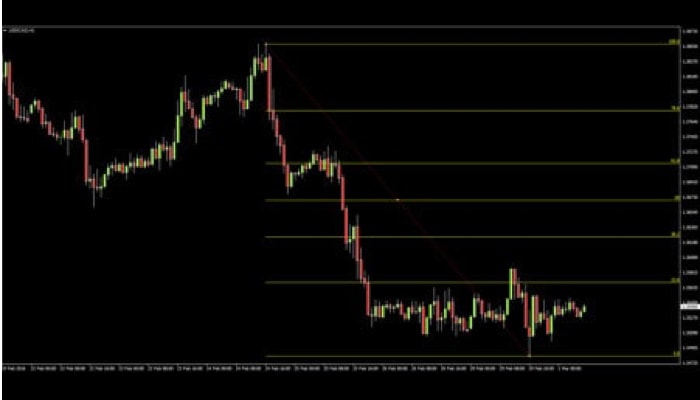
Let’s take another look at USDCAD:
Despite a false break above in late February, pair is essentially capped by the 23.6 Fib. Above the 23.6 we have the 38.2, a break above the 23.6 would likely encounter resistance here. These levels are very common; a trend can retrace these percentages and still be considered healthy. Next we have the 50% mark, note this level is important as it coincides with former support. Above 50% and traders are beginning to question the recent move – is this a retracement or a reversal? Having said that; 61.8 retracements, prior to continuation are also fairly common. The 78.6 is considered the be all and end all – if a pair retraces more than 78.6% of the prior move, chances are it’s heading straight back to the origin (100%). It may have completely reversed direction or is range bound.
A trader with a bearish bias on USDCAD would wait for a break above the 23.6 and look for a reaction at one of the higher fib levels, before entering short. On the other hand, a trader with a bullish bias might trade a break above the 23.6 with a stop below the recent lows, or wait for a break above one of the higher fibs.
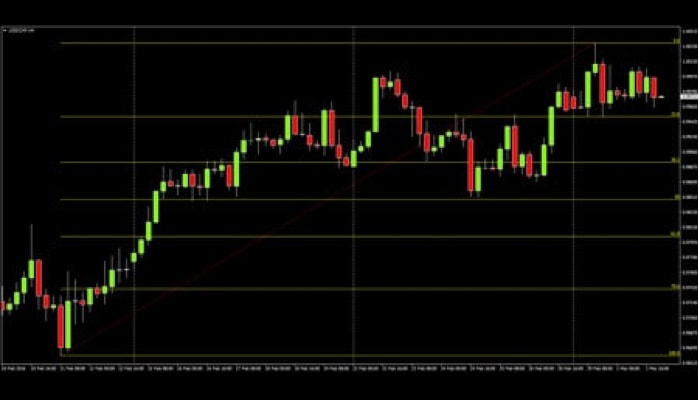
The previous examples were all assessing down moves; let’s take a look at an up move:
The process is the same, but instead of dragging the Fibonacci tool from the high to the low; we drag it from the low to the high. A trader looks at this chart and see’s USDCHF is trending up and decides they want to buy. They know not to buy into resistance, so they use the Fibonacci tool to identify probable support levels. They notice that price seems to be respecting the 50% level and decide they will attempt to enter long there. They have two options:
1) Watch and wait for a correction to, reaction at the 50% level
2) Place a Buy Limit order just above the 50% level
The first option is probably ‘safer’, as the trader is not blindly buying into a potential support level. On the other hand, the second option means the trader does not have to sit and watch the market. Either way, our trader has four options for placing their stop, depending on their risk tolerance:
1) A tight stop just below the 50% level
2) A more reasonable stop below the 61.8
3) A considerably looser stop below the 78.6
4) A stop below 100 – if price moves below here the trader’s bullish bias is unquestionably invalidated as pair has set a new low
The first option is likely a little too risky, most traders would probably opt for the balanced choice under the 61.8. With the latter two, the trader risks holding on to a losing position for longer than necessary and is sacrificing reward.
Fibonacci Retracements are a great way of identifying potential support and resistance levels. When analysing a down move, the trader uses the tool from the high to the low. When looking at a rally, the trader drags from the low to the high. The standard 23.6, 38.2 and 61.8 Fib levels are great, but many Fibonacci traders add in the 78.6 and 50 levels too. Trade breaks of key Fibs or reactions, depending on your strategy and bias.
Moving Averages are by far the most widely used and easy to understand Forex indicator. They display right on top of your chart and mechanics are very easy to understand – a moving average or MA – is quite simply the average price over a given period.
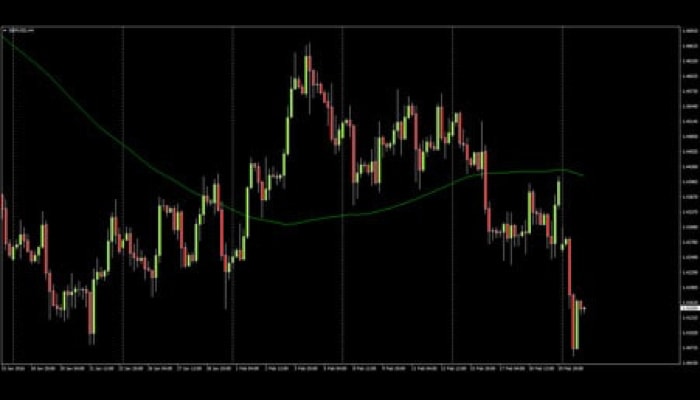
This is one of the more common Moving Averages – SMA100 – the Simple Moving Average of the close price for the last 100 bars. We have placed the SMA100 over the GBP/USD Forex pair on a 4 hour chart.
The simplest form of MA analysis is checking where price is in relation to the MA – is price above the 100SMA? Look to buy. Is price below? Look to sell.
That is, when GBP/USD is above the 100SMA, we will look to buy lows, when it below the 100SMA, we will look to sell highs:
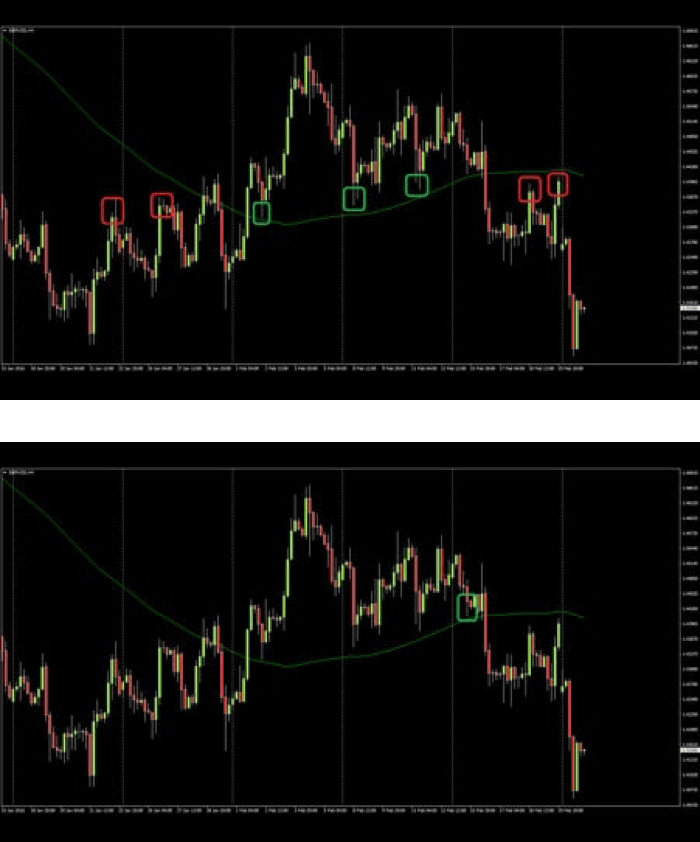
As you can see, this is quite a reliable strategy at first glance – all the marked highs below the SMA lead to substantial declines and all the marked lows above the SMA lead to substantial bounces. Realistically though, this image was created with the benefit of hindsight – a live Forex trader may well have bought the final touch of the 100 SMA:

Even so, GBP/USD did appreciate 75 pips before eventually breaking lower – Our hypothetical trader could have taken profit, moved his stop loss to break-even or, lost a small amount when pair breached the SMA. Let’s say the trader lost on this one, but 7 wins out of 8 trades is still extremely impressive!
You will rarely see a moving average in isolation like this, most traders will use a combination of a ‘fast’ and ‘slow’ moving average. We go into more detail on moving average trading in the next section.
In the last section we looked at Moving Average crosses and using Moving Averages to determine the trend. In this section we will move on to a new type of indicator – the Oscillator. Unlike the MA, Oscillators tend to appear below your MT4 chart in a separate window. We’re going to take a look at one of the most common oscillators, the Relative Strength Index or RSI:
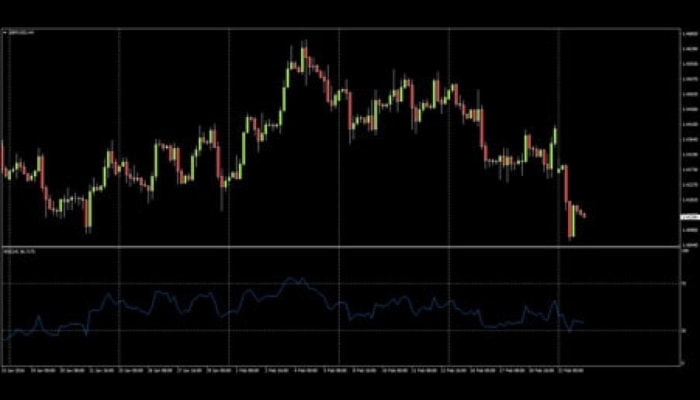
RSI looks at an instrument’s ability to close higher/lower over a given period. When RSI is above 70, a Forex currency pair is considered ‘overbought’ and when it’s below 30, it’s considered ‘oversold’. It’s important to note that just because a security is overbought/oversold, does not mean it’s going to reverse – Indicators can read overbought/oversold for extended periods of time. A sell signal does not occur until RSI crosses back from overbought/oversold into the 70-30 range:
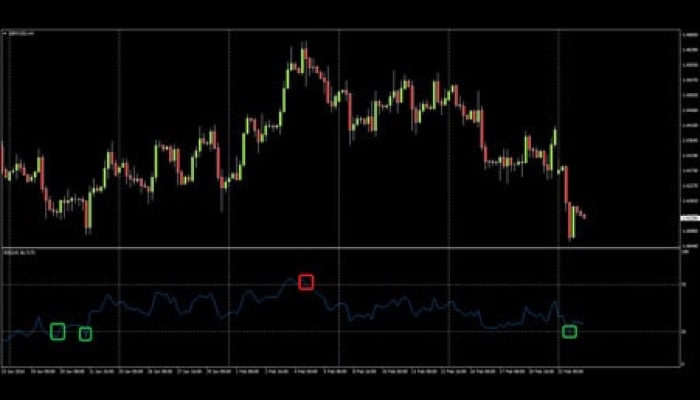
Let’s look at the first buy signal – when RSI crosses back above 30 on the 20th of Jan. Note that the Forex pair actually sets a new low (and issues a second signal) before moving higher. The first signal occurs at 1.4182, the new low is over 100 pips lower at 1.4079 – chances are most traders would have been stopped out on this signal.
The second buy signal is better, but there is still significant whip saw before the trader eventually nets 380 pips. This sell signal tells the trader to exit their long and go short – the Forex trader then proceeds to make another 422 pips before the next buy/exit signal!
So let’s have a look, our hypothetical RSI trader’s first trade was a loss of 100 pips, before making 380 and 422 pips on his second and third trades. That’s 2 wins out of 3 trades, with a net profit of 702 pips!
But what now? RSI is telling the Forex trader to buy even though the currency pair has just broken below the late February lows. The trader could well lose 110 pips on this signal. That would bring their win rate down to a more realistic 50% and net profit to 590 Pips.
What if our trader had ignored buy signals? GBP/USD is in a major down trend after all. Well, we would have had 1 trade, 1 win and net profit of 422 pips. Over such a small sample size it is hard to compare the two, but long term testing shows better performance when trading RSI with the trend.
Even the best Forex traders in the world have losing trades – losing is a part of trading – but how do you react when you lose? How do you feel? If you’re angry or sad; chances are you were risking too much, or taking a trade you knew you shouldn’t – or both.
Whether looking at a successful breakout trader, trend follower or scalper; there is always a common theme: they all have a trading system and they stick to it. These traders don’t get emotional when they take a loss; they were trading according to their rules and the trade didn’t work out. They lost a pre-determined amount they were comfortable with and accept it as an unavoidable part of trading. They move on to the next trade, knowing their system is profitable over the long term.
An inexperienced Forex trader might open a long position in an uptrend thinking the market is continuing to move up. They didn’t put a stop loss on the trade, as they were confident about the overall direction and worried about getting needlessly stopped out. They think “I’ll exit if it moves against me” … Bearish news breaks and the market quickly move 100 pips against them. They are now looking at a 100 pip loss when it could have been limited to a fraction of that.
Now what? The market snaps back 50 pips. The inexperienced trader is relieved “maybe it’s going back up?!”. BAM! classic 50% retrace before continuation: the market falls another 100 pips. This is too much for our trader; he finally cuts the trade at the lows, losing 150 pips. Over the next few sessions the pair recovers to his original entry and beyond, in line with the trend. Did they do the right thing, cutting at -150? Maybe – it well could have continued to fall.
The fact is, our trader should have never been in this position in the first place and was forced to make a less than optimal decision. If they’d had a clear exit strategy in place, there would have been no question about what to do. Their stop loss would have been hit or they would have exited manually, (yet systematically) for a much smaller loss.
Whether your entries are discretionary or systematic, you should always have a clear exit plan for each and every trade. Don’t be left saying “What do I do?”
Plan your exit and react accordingly.
If you want to be a successful Forex trader, greed is probably the biggest obstacle you’ll have to overcome. If you try to get rich on every trade, you’ll more than likely end up blowing your account – slow and steady wins the race. It’s the great paradox that all traders face – if you want to get rich quickly, you have to do it slowly.
Imagine you’re risking your entire balance on a trade. Sure you might win the first two, or three trades and triple your balance a few times, but eventually you’ll lose one (and lose everything!). Now what if you were still aiming to make double your risk when you trade, but only risking 1% per trade? Say you place 10 trades in a week and get half of them right – 5 winners/5 losers:
1. -1%
2. +2%
3. -1%
4. -1%
5. +2%
6. -1%
7. +2%
8. +2%
9. -1%
10. +2 %
Total = +5%
Okay, so with your modest $5000 balance that might not be life changing ($250 a week)… but what happens when you compound that return over a year?
5,000 x 1.0552 = $63,214
That’s a return of over 1,260% without ever risking more than 1%. Now work out the return for the following year!
You can get rich relatively quickly through trading Forex, but it doesn’t happen overnight. It happens over hundreds, if not thousands, of systematic, high probability and low risk trades. In order to ‘get rich quick’, you have to be patient – If you truly want to satisfy your greed, keep it in check.
Are you ready to take the next step in your Forex trading? It’s time to open a live account with Ultima Markets!


